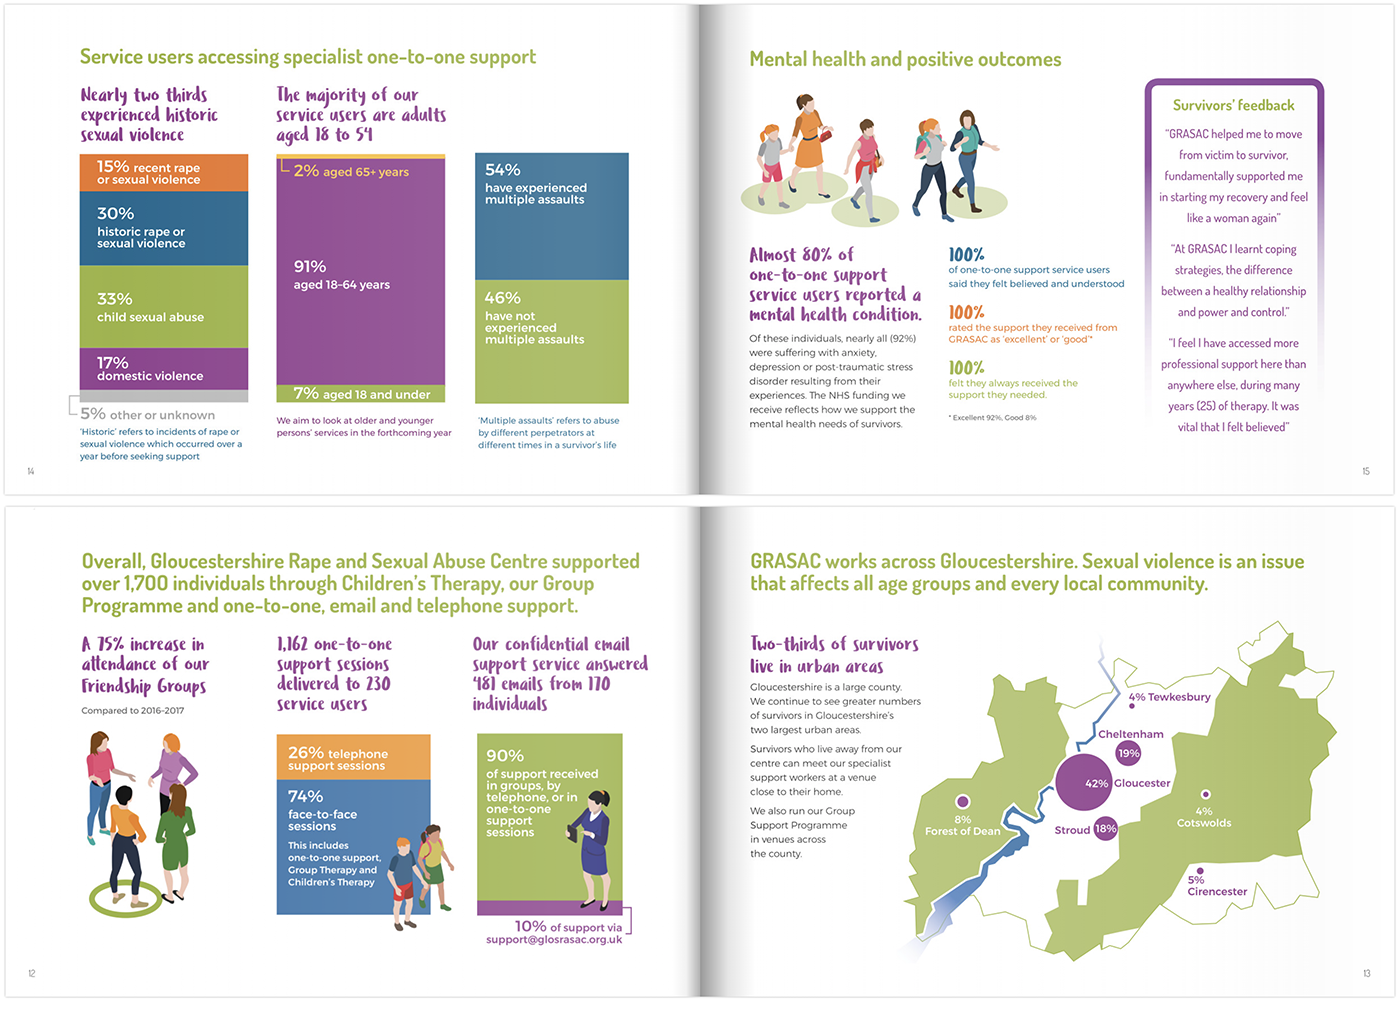
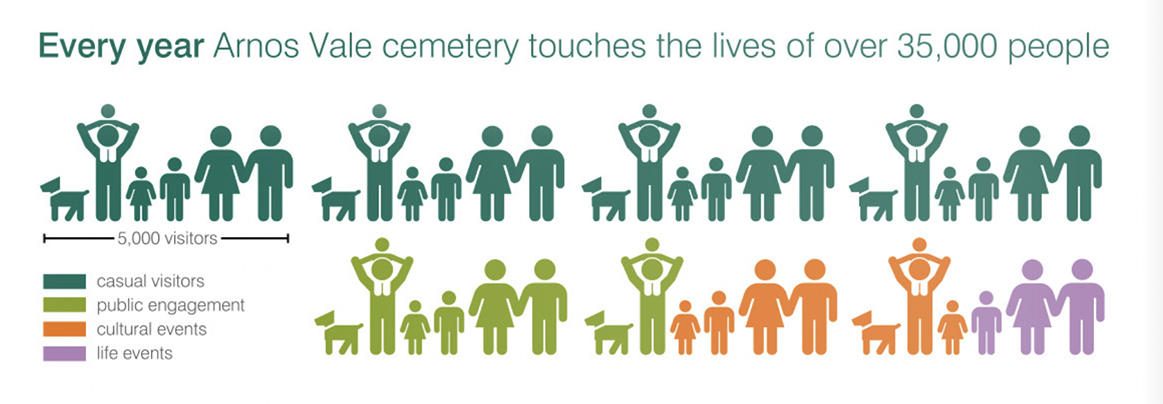
Data visualisations support case-for-support texts by providing accessible at-a-glance informattion. Infographic styles match the organisation's brand and add interest to numeric data that might be otherwise difficult to suggest.
Infographic: Interpret and summarise supplied data on the charity’s impact, activities and outcomes.
Client: Gloucestershire Rape and Sexual Abuse Centre (GRASAC)
Overview: GRASAC’s annual report describes its activites, financial standing and future plans. The document has a dual use as a case-for-support document – such transparency is appreciated by funders
Two annual report double-page spreads:

Client: Arnos Vale Cemetery Trust (AVCT)
Overview: The cemetery has become a community resource: people visit for educational tours, cultural event, or a walk as well as burials. Funding was sought to maintain the urban green space for the local community.
Infographic: Summarise and illustrate the text, emphasising community usage.
Data visualisation appeared under text outlining the cemetery's community use:
