A picture is worth a thousand words. I design maps and infographics that simplify complex information and make it easy to understand. I work with heritage, charity, community and public sector teams to turn data, routes and research into clear, visual communication for print and digital projects
maps / infographics
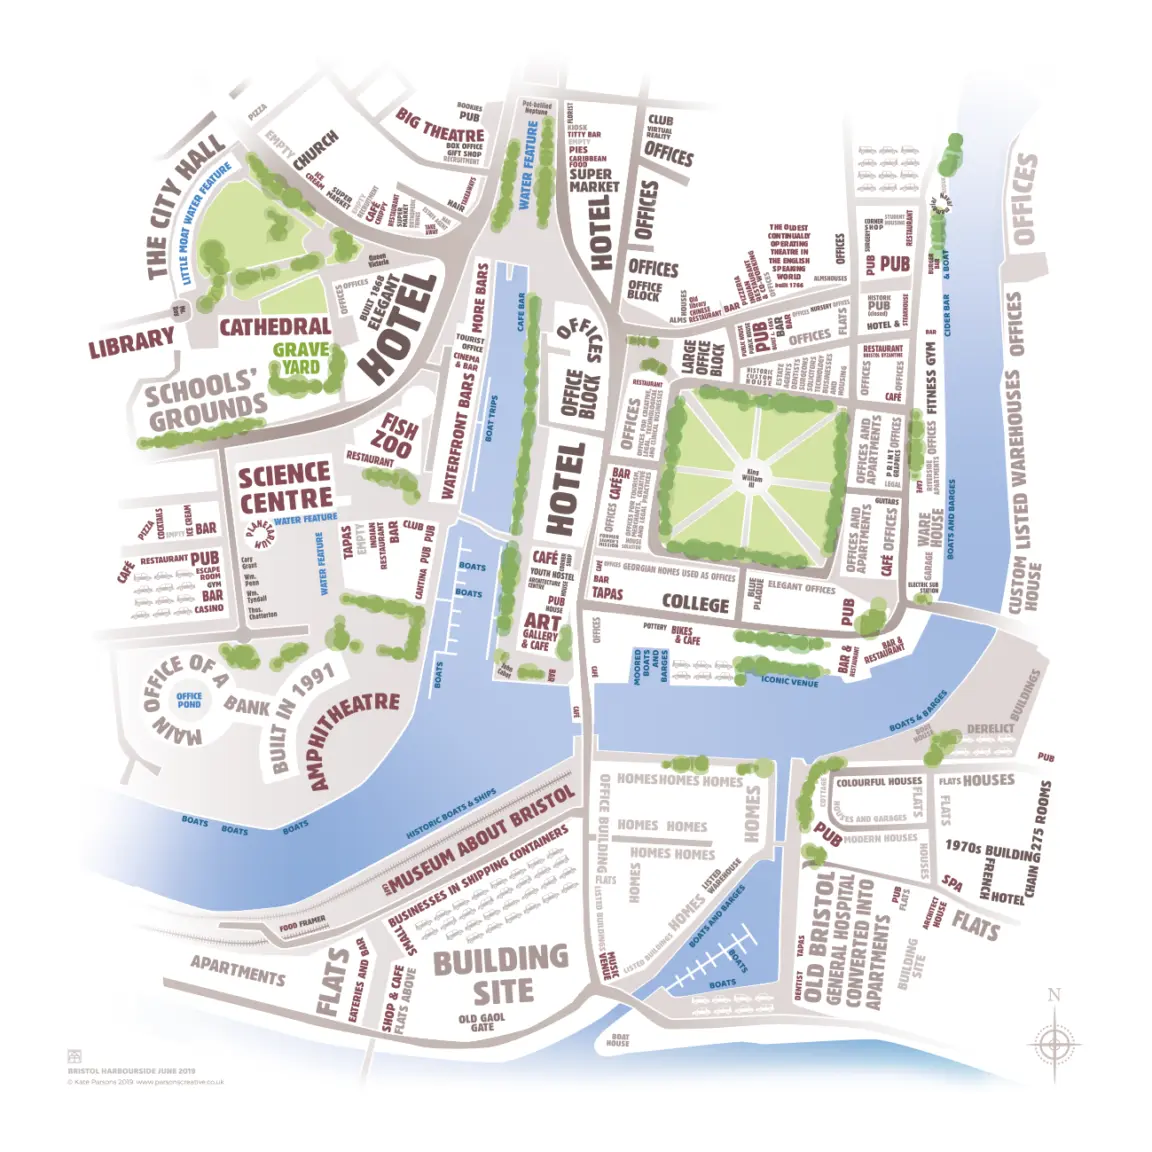
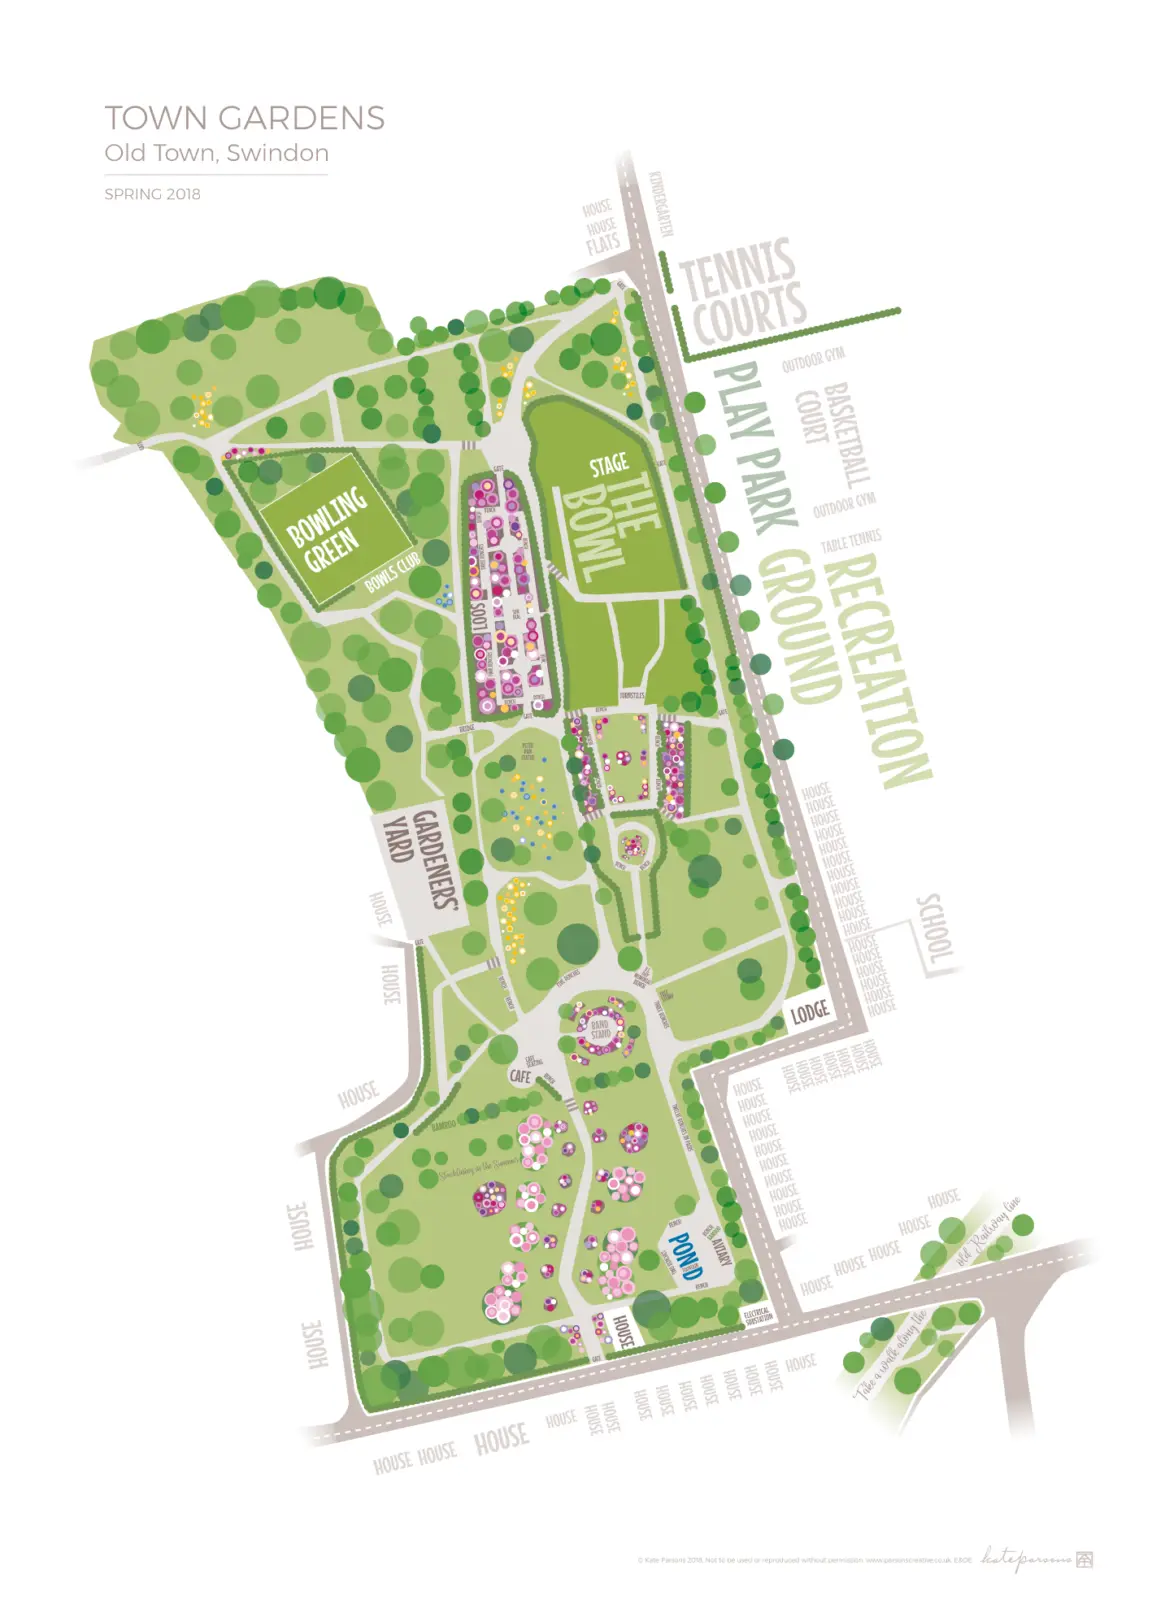
Typographic urban maps
Bristol Queens Square and Harbourside. Available to buy as a print.
Map-making started as a personal project to 'spell out' what exists in areas of Swindon and Bristol. It has led to numerous commissions to create maps for cycle, culture and heritage trails, Heritage Open Days and civic placemaking.
Old Town Gardens, Swindon. Limited edition 'spring' print sold out; autum edition still available to buy.
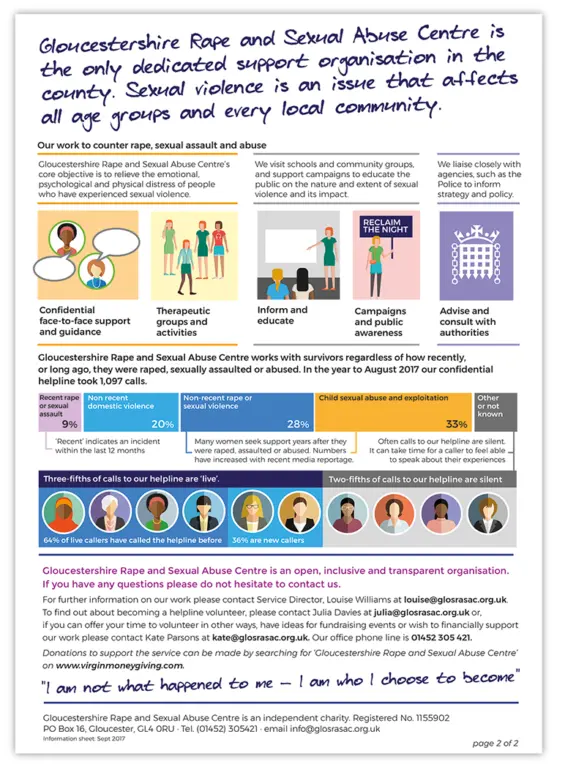
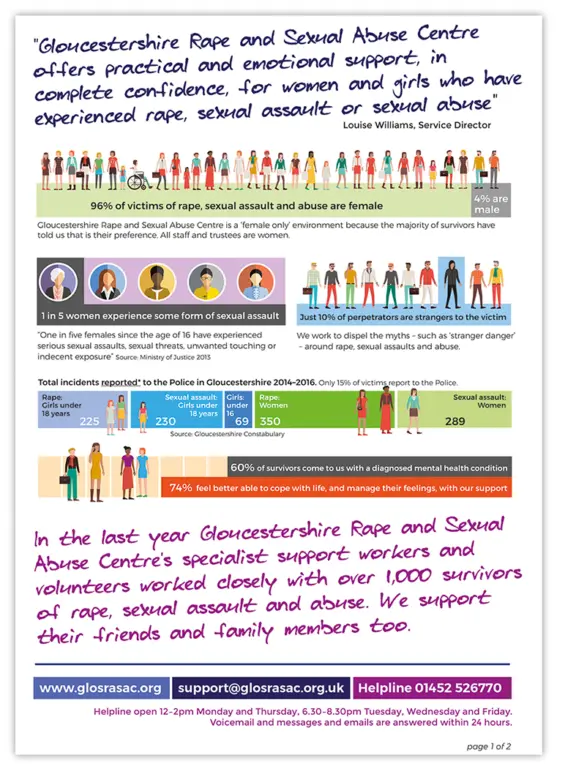
Fundraising and awareness mailing: Gloucestershire Rape and Sexual Abuse Centre
Making sensitive information, complex statistics and issues accessible and engaging. Mailed to 42 identified Gloucestershire philanthropic social groups (e.g. Lions, Rotary, Round Table). Achieved return on investment (ROI) of 1:46; response rate: 19%. Provoked invitation to give a presentation / talk (resulting in large donation); invitation to apply directly for further funding.
Created before the charity's new brand was launched. It too incorporated a handwritting font (humanising the communications) and 'anonymised' stylised figures for the info graphics
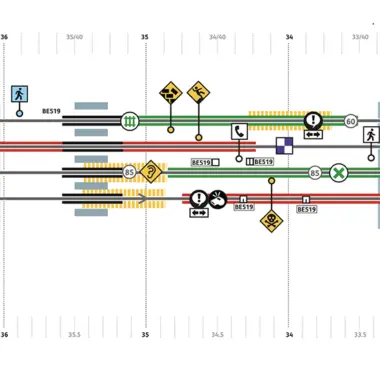
A mammoth project over three years and multiple iterations. Working with risk management consultants, Network Rails management and trackside staff to improve workers' safety.
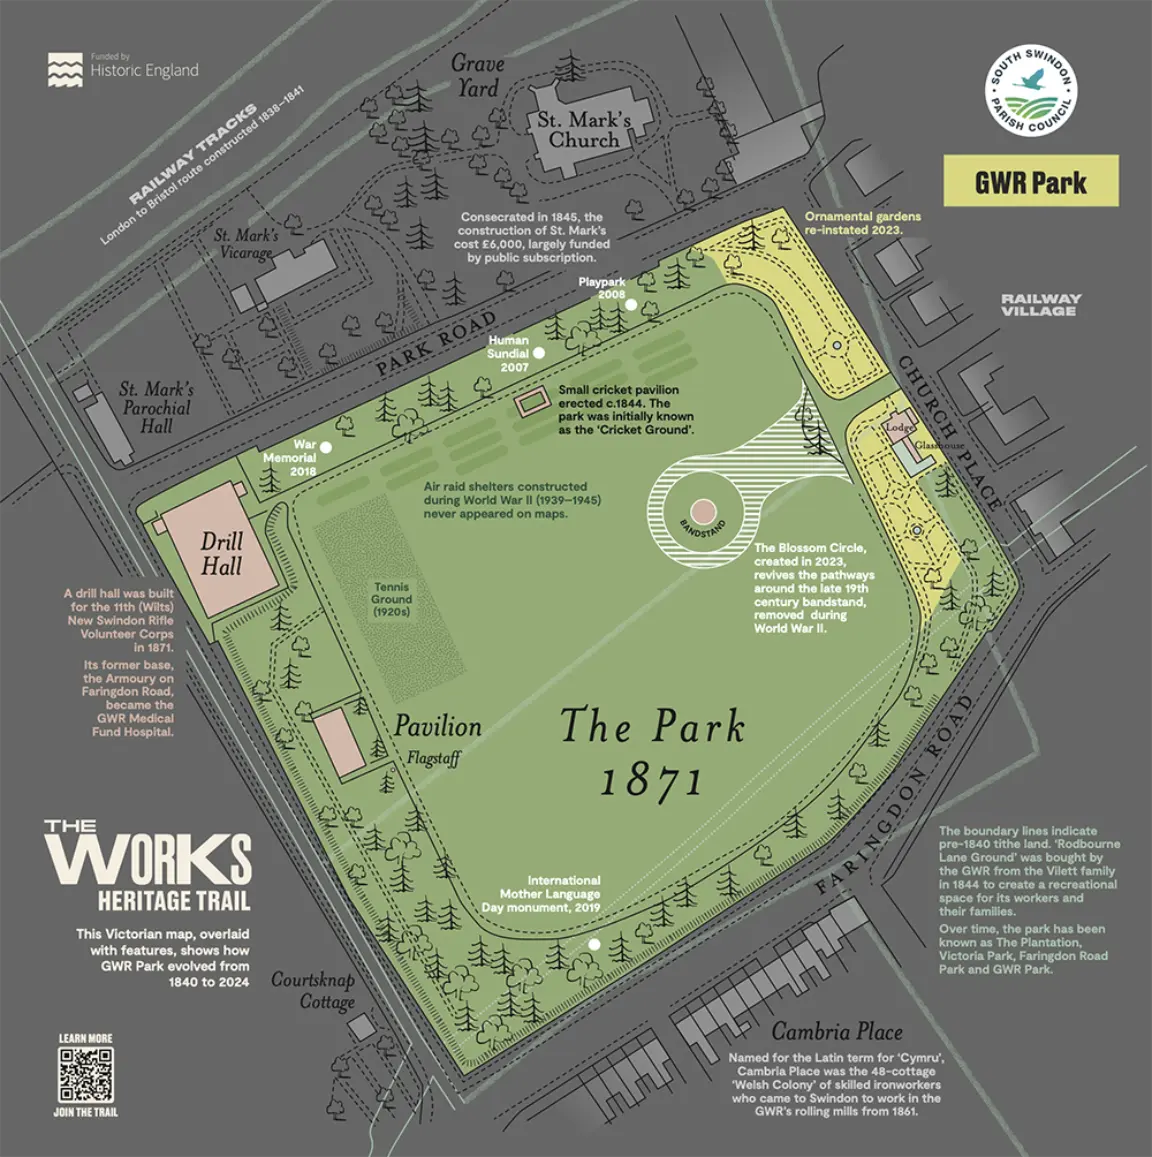
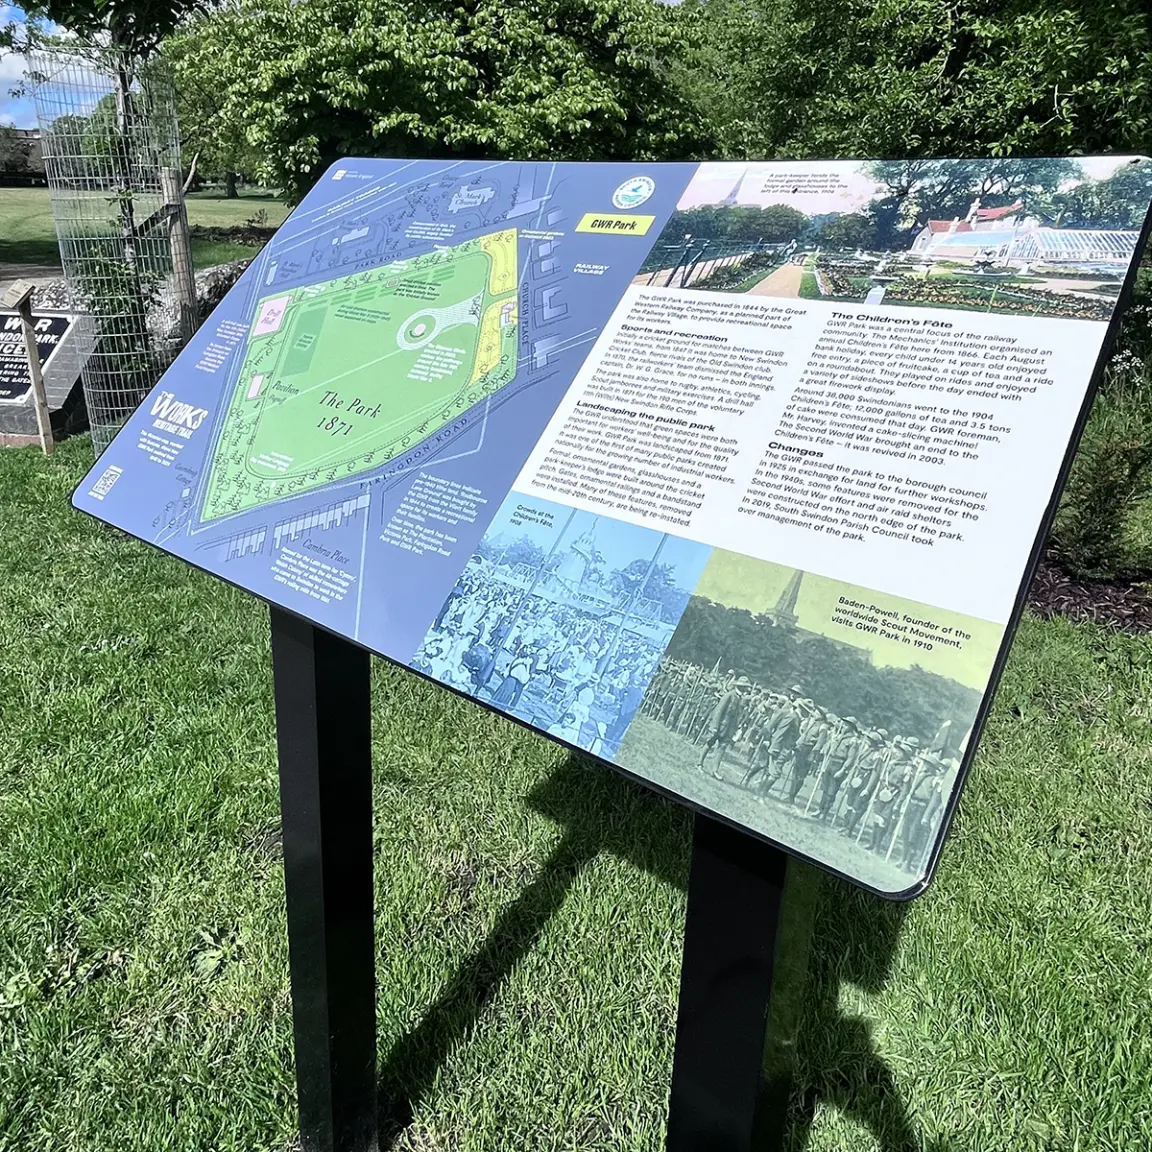
Section of the Works Heritage Trail interpretation panel in GWR Park Swindon
Created by tracing over a Victorian OS Map (black line art), I added shaded areas, colour, drawn elements and historical information to show the evolution of the park over time. See The Works Heritage Trail.
maps / heritage interpretation
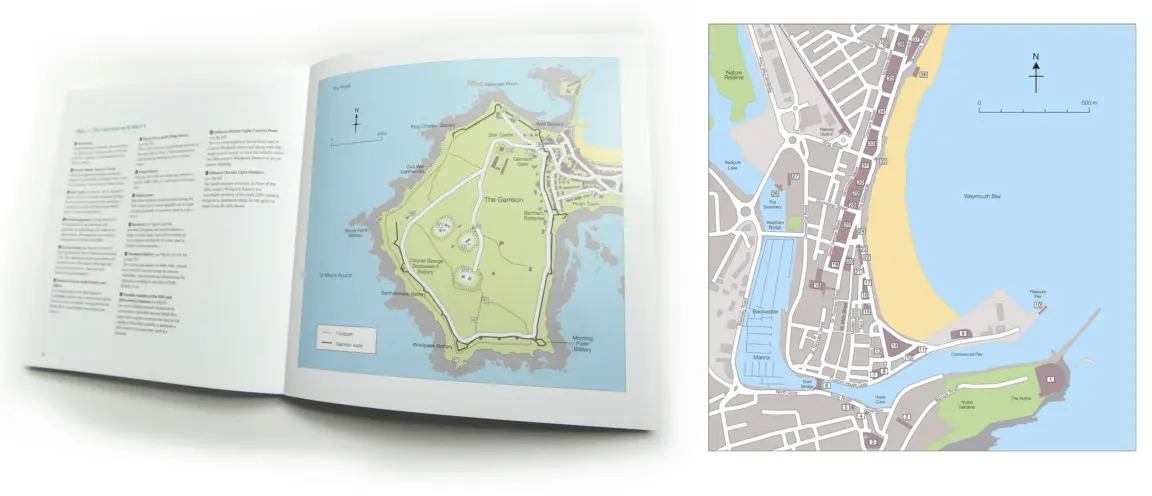
English Heritage Informed Conservation book series
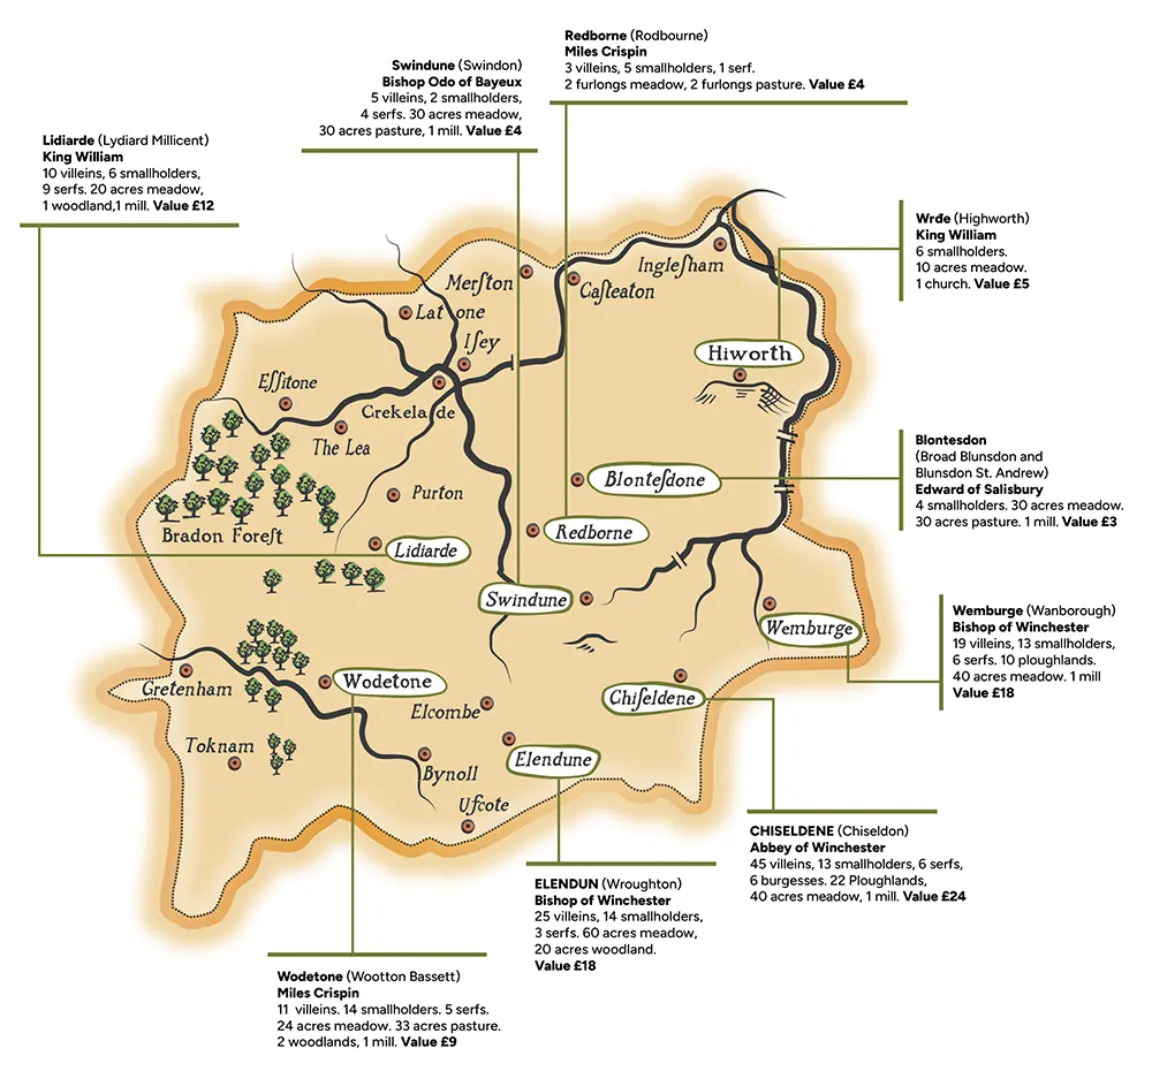
Vector-drawn map based on John Speed's map of 1611. This was the oldest, good quality map reference supplied by the museum for their display on local towns' values at the time of the Norman conquest (600 years earlier!)
Vector-drawn images can be recolured and scaled to print at any size. Colours and font to fit the Museum's gallery.
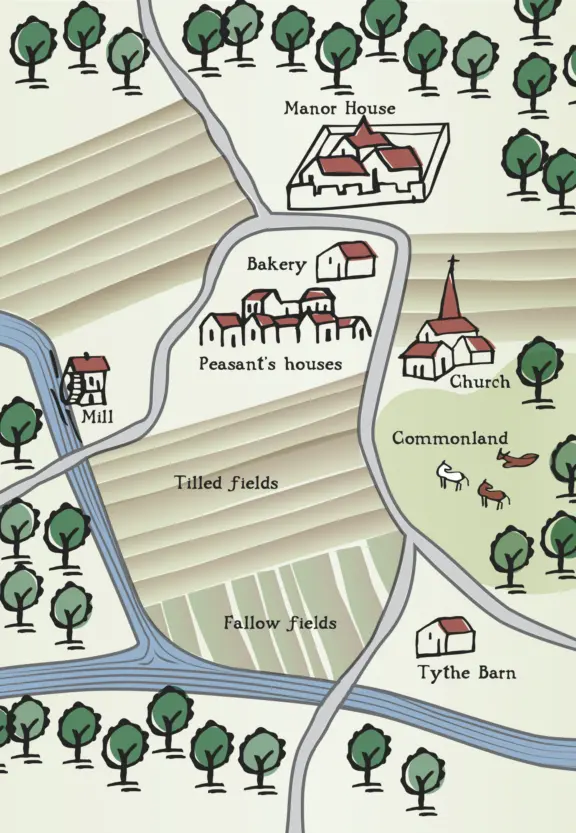
Stylised map illustrates the manorial system in the museum's Medieval Swindon gallery.
maps / placemaking
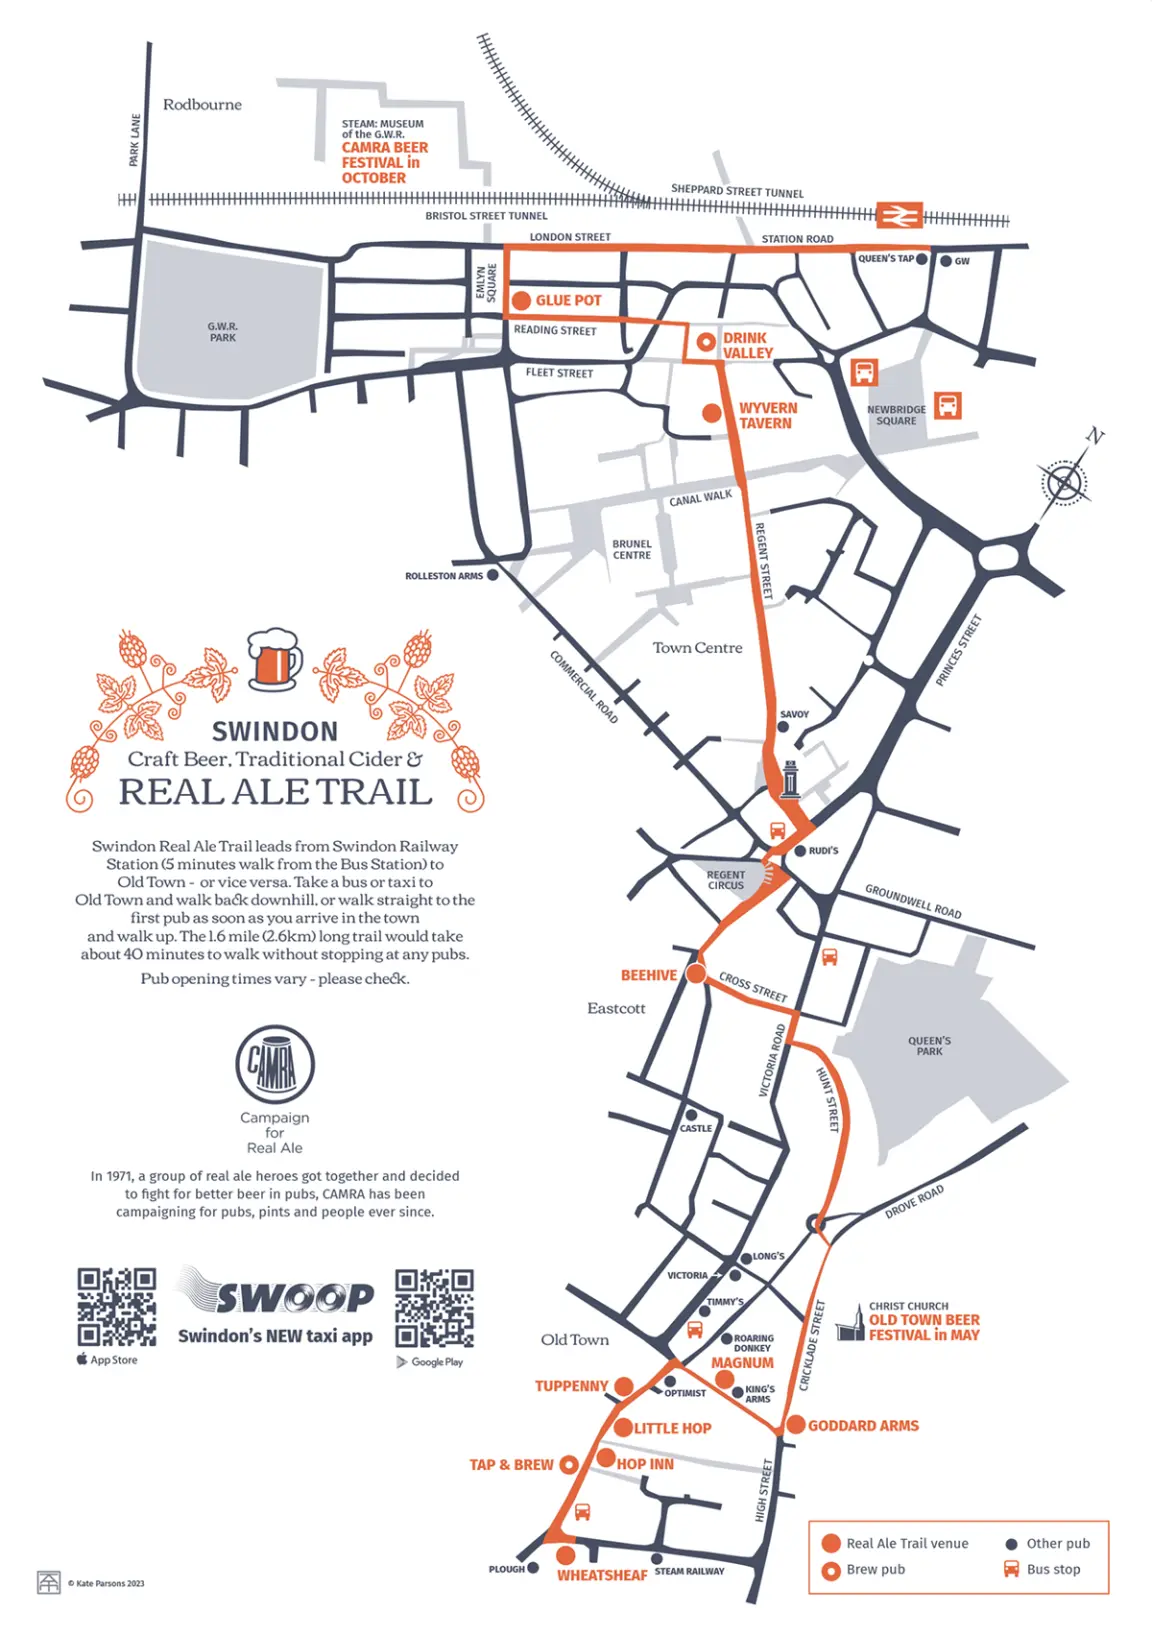
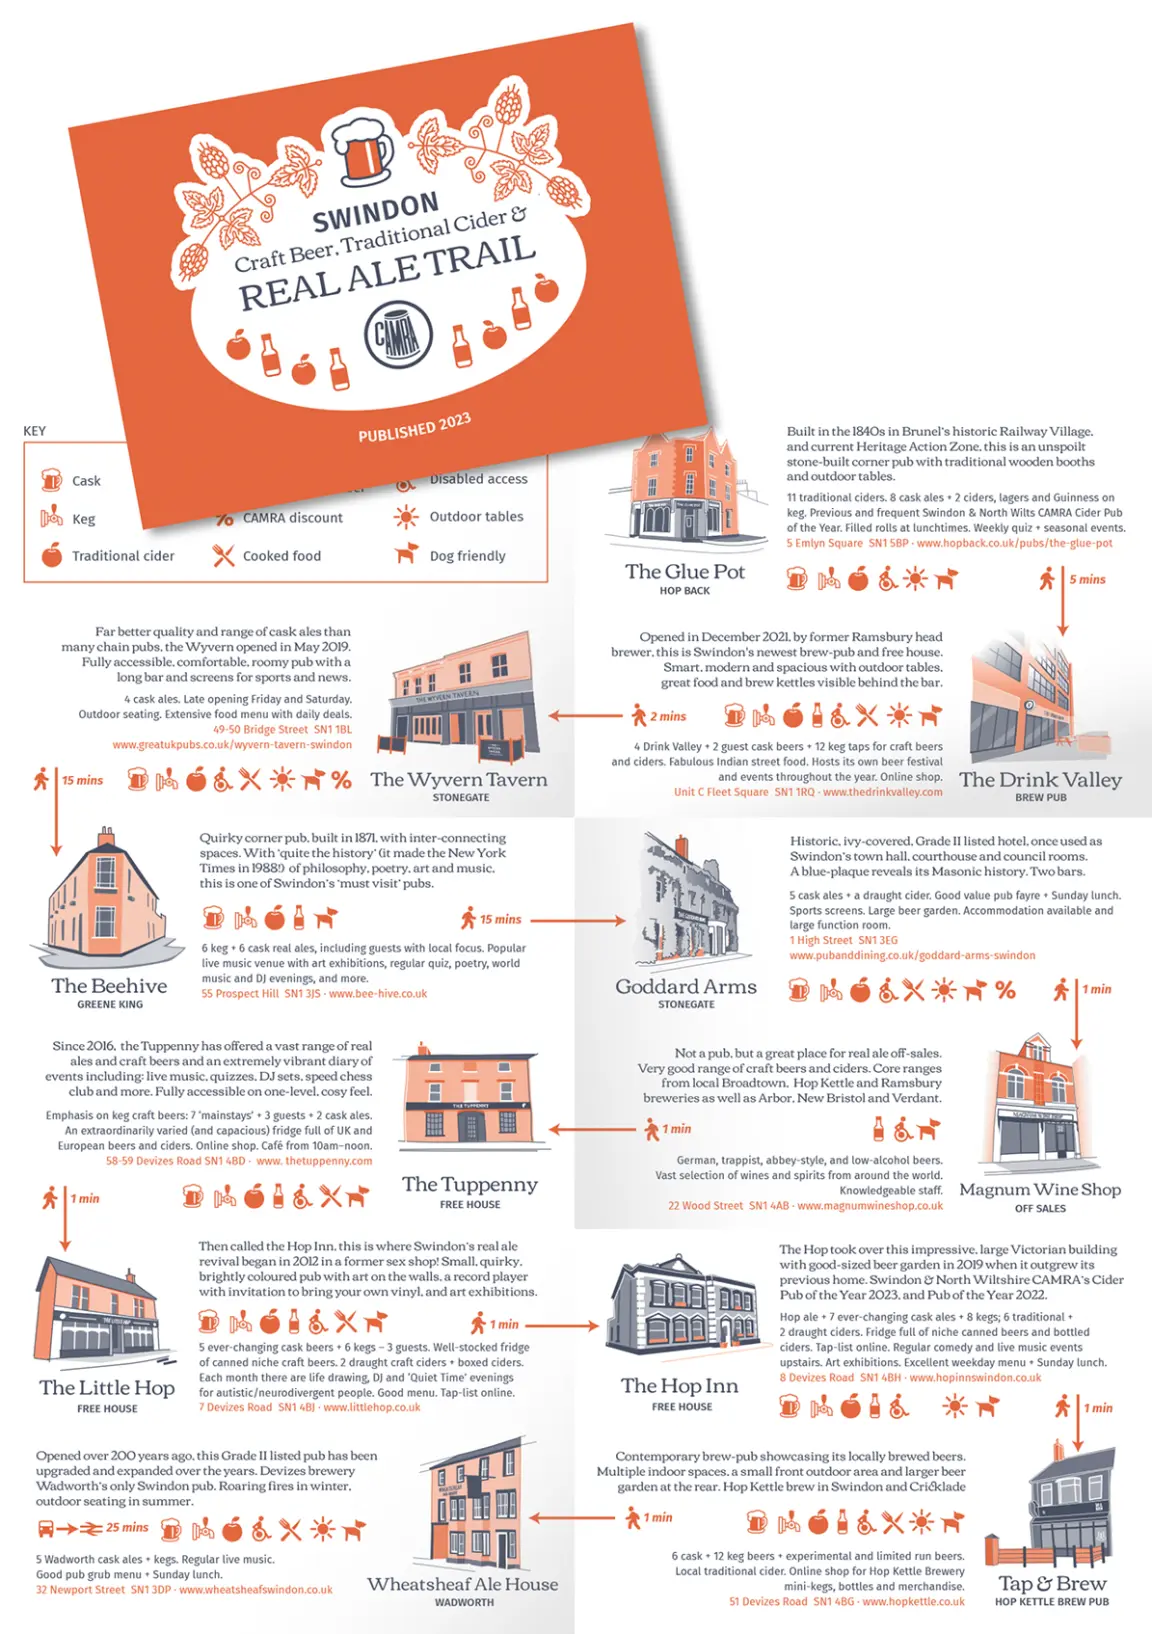
Swindon Real Ale Trail
Self-initiated project in partnership with Swindon & North Wilts Campaign for Real Ale (CAMRA). Swindon is one of the best real ale destinations in the UK. I thought we ought to be proud of that. Two spot colour print.
Each pub paid a fee to cover my time, printing and leaflet dispensers.
Double-sided leaflet and guide folds to A6 postcard size. I illustrated each pub.
maps / civic placemaking
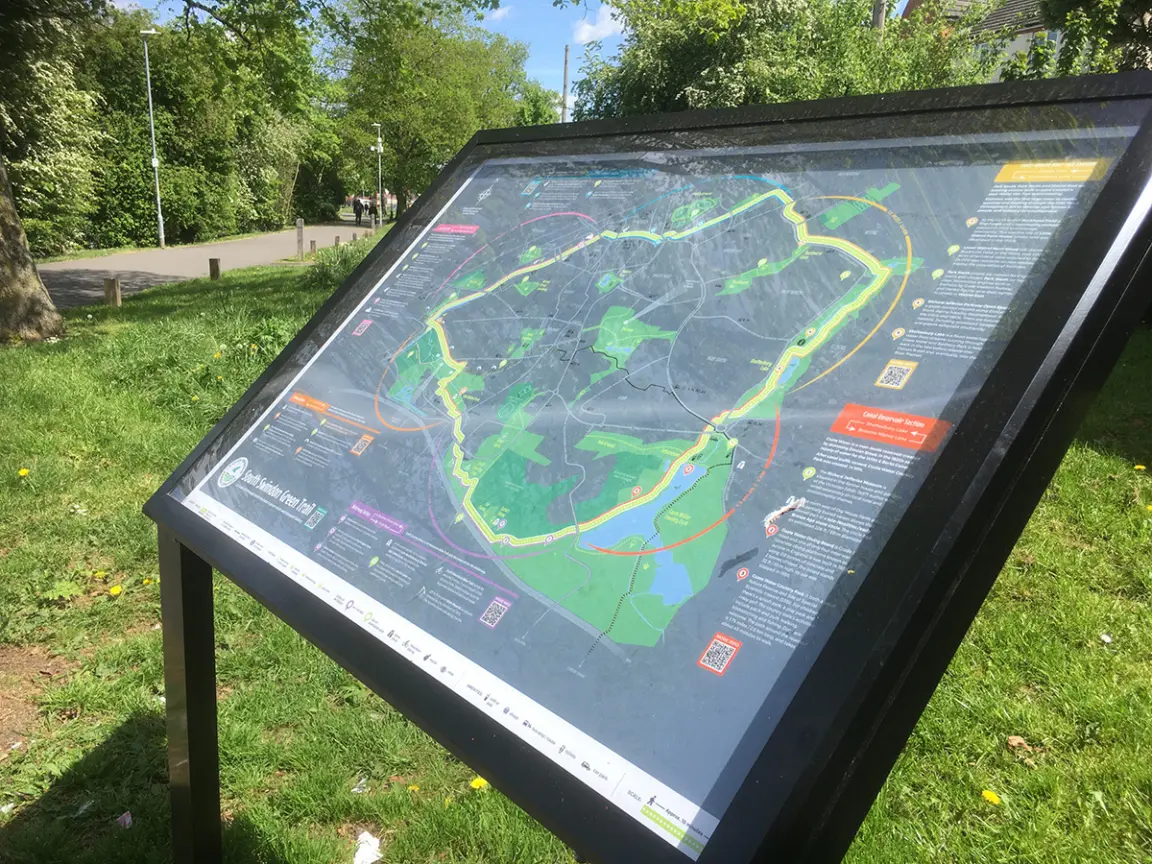
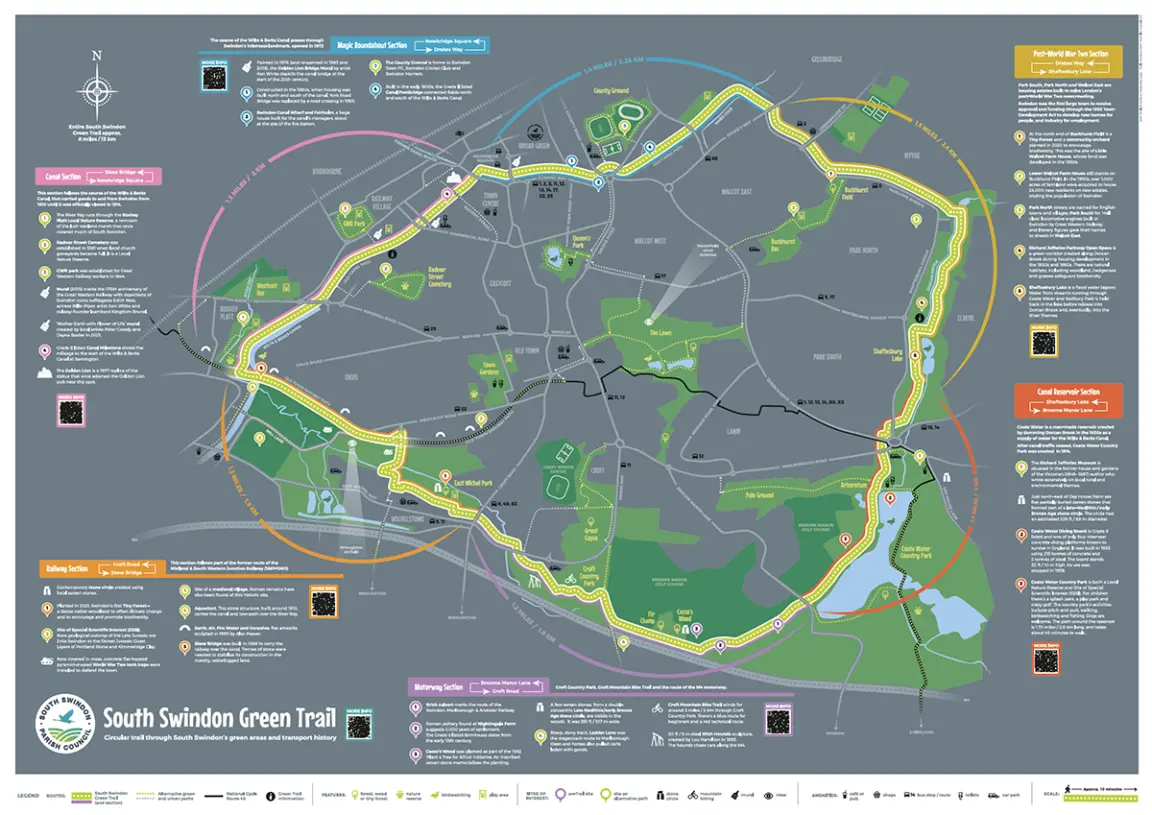
South Swindon Green Trail
Helped to define the route and created a sectioned map for display at locations along the route, plus downloadable maps and guides for each section.